Questions? Look here

FAQ Categories

The Map

Locate the Layer button (top-right of the map). By clicking on it, you will be able to switch between the Terrain map, the satellite images or the NDVI.

Locate the Layer button (top-right of the map). By clicking on it, you will be able to select the NDVI base layer.

The data displayed on the map is filtered by sensor type, either linked to irrigation or Weather. For example, a device that only has weather related sensors connected will not be visible on the Irrigation data layer.

Soil Tension

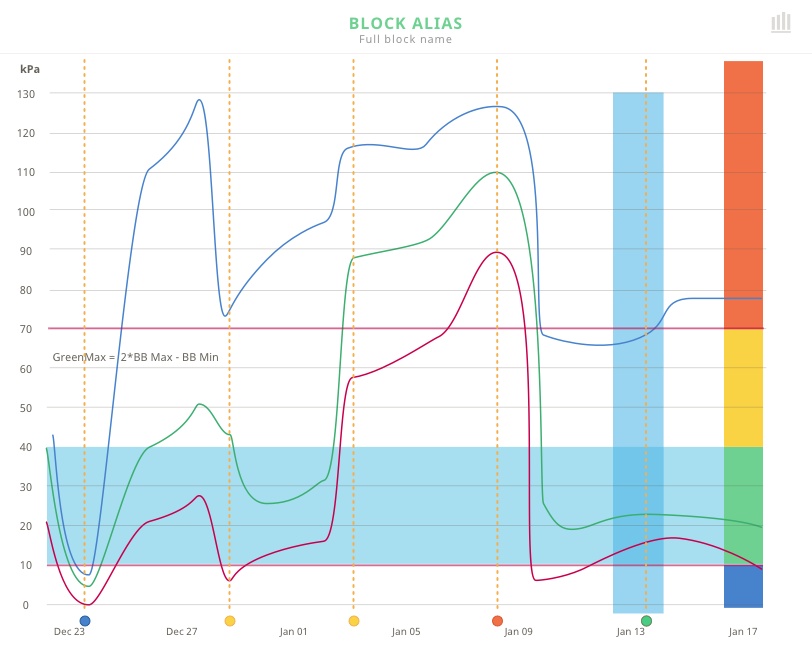
LOW  Tension status is low when at least one tension is in the optimal productivity zone.

MED Tension status is medium when no tension is in the blue band, at least one tension is above the blue band and not higher than twice the optimal productivity zone.

Ex: An optimal productivity zone between 10-40 kPa, a medium tension needs to be above 40 kPa but below 70 kPa.

HIGH Tension status is high when all tensions are above twice the optimal productivity zone.

Ex: A blue band between 10-40 kPa, a high tension needs to be above 70 kPa.

WET Tension status is wet when all tensions are below the optimal productivity zone.


The High Tension Blocks widget lists all the blocks that require immediate attention. 

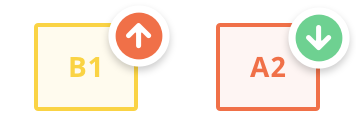
A red arrow pointing up means tension is rising. 

A green arrow pointing down, means tension is dropping.

No arrow means tension is steady.

Yes. In the web version of the app, simply go to the settings, under the Blocks tab and drag the blocks into your preferred order using the three little lines icon.

Yes. In the web version of the app, simply go to the settings, under the Blocks tab, use the + button at the bottom right of the screen to create a new group. Give it a name and a alias, then select the blocks to be included in that group.

Yes. In the web version of the app, under the Schedule menu. Make sure to select the advanced mode.

Temperature and Weather

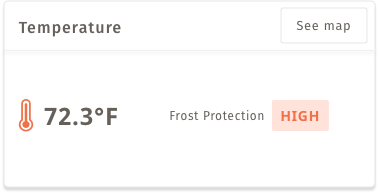
Temperature protection will automatically switch between modes: frost protection (when temperature is below 50°F (10°C)) and heat protection (when the temperature is above 50°F (10°C)). The status are based on the minimum and maximum temperatures entered in the settings.


Frost Protection

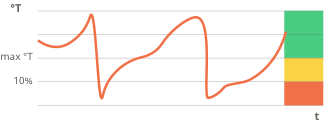
  FIX the image. Says Max T, should be MIN T.

LOW  Temperature status is low when the temperature is above the minimum T° set value.

MED Temperature status is medium when the temperature is below the minimum T° set value but not more than 10% of this value.

HIGH Temperature status is high when the temperature is more than10% below the minimum T° set value.


Heat PROTECTION


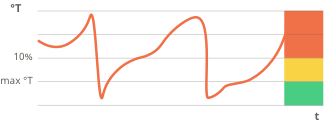
LOW  Temperature status is low when the temperature is below the maximum T° set value.

MED Temperature status is medium when the temperature is above the maximum T° set value but not more than 10% of this value.

HIGH Temperature status is high when the temperature is more than10% above the maximum T° set value.


The value displayed on the dashboard corresponds to the most extreme value being recorded for the whole site. Temperature protection will automatically switch between frost protection (when temperature is below 50°F (10°C)) and heat protection (when the temperature is above 50°F (10°C)). In frost protection mode, the temperature will be the lowest recorded. In heat protection mode, it will be the highest. 

Imagine a rectangle extending to cover all the pins on the map. The centroid of the rectangle is sent to the weather service which returns the weather for the nearest weather station available for this point.

We have noticed that sometimes, during a great heat period, the forecast temperature is higher than what other vendors forecast for some locations. The nearest weather station for our weather service might be at a different location than the one from another provider which could explain some differences in the forecast.

By clicking on the weather forecast icon at the top of the schedule.

Login

If your account is suspended. Wait 2 minutes before trying to login again.

If your account is disabled, please contact your sales representative.

Below the login button, click on Reset Password. Enter your username or the email linked to your account. An email will be sent to you with instructions on how to reset your password.

The Schedule

Use the + button to open the Create Event tool. Then enter the mandatory information.

  • Block(s) for which the event is for.
  • If it is an event that can start anytime during the day or at a specific time.
  • The date and time at which the event will start
  • The duration for this event

Today’s Activities widget informs you about your irrigation schedule of the day and let you know if you missed a planned irrigation. It consists of 3 metrics: the number of irrigations currently ongoing, if there are any planned irrigations that are not running when they should. And the total of planned irrigations for the day.

This widget is only for planned manual irrigations and does not take into account the planned automated irrigations.

Simply by clicking on the event icon.

The note was probably created by another user. It is only possible to edit a note that you have created.

Yes. In the web version of the app, on the schedule page, mouse over the + button at the bottom right to open a menu. One of the option will be to print the schedule.

Automation

Lorem ipsum dolor sit amet, consectetur adipiscing elit. Ut elit tellus, luctus nec ullamcorper mattis, pulvinar dapibus leo.

Lorem ipsum dolor sit amet, consectetur adipiscing elit. Ut elit tellus, luctus nec ullamcorper mattis, pulvinar dapibus leo.

Yes. If you stop a event using the app, it will stop an ongoing irrigation, regardless if it was started manually or by schedule.

Alerts

Lorem ipsum dolor sit amet, consectetur adipiscing elit. Ut elit tellus, luctus nec ullamcorper mattis, pulvinar dapibus leo.

Lorem ipsum dolor sit amet, consectetur adipiscing elit. Ut elit tellus, luctus nec ullamcorper mattis, pulvinar dapibus leo.

The Blue Band Index

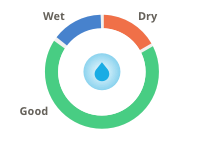
The Blue Band Index is a 7-day metric to predict the performance of each of your blocks. It corresponds to the proportion of time the tension was in the optimal productivity zone versus being too dry or too wet. An average of all available sensors of a block is used.

Lorem ipsum dolor sit amet, consectetur adipiscing elit. Ut elit tellus, luctus nec ullamcorper mattis, pulvinar dapibus leo.

Lorem ipsum dolor sit amet, consectetur adipiscing elit. Ut elit tellus, luctus nec ullamcorper mattis, pulvinar dapibus leo.

The Water Report and Irrigation Events

Lorem ipsum dolor sit amet, consectetur adipiscing elit. Ut elit tellus, luctus nec ullamcorper mattis, pulvinar dapibus leo.

The data is real-time.

The pressure sensor might be broken or defective. It is possible as well the device was removed for maintenance while an irrigation was being recorded.

Miscellaneous

Lorem ipsum dolor sit amet, consectetur adipiscing elit. Ut elit tellus, luctus nec ullamcorper mattis, pulvinar dapibus leo.

Lorem ipsum dolor sit amet, consectetur adipiscing elit. Ut elit tellus, luctus nec ullamcorper mattis, pulvinar dapibus leo.

Yes, it is possible to make the display bigger.

On an iOS device, from the settings of your phone, go to Display and Brightness and select Display Zoom. Select the option Larger Text. Please note, this will impact the display globally, not just for the Hortau App.

On an Android device, from the settings of your phone, go to Display size and text and slide the Display size slider to the desired magnitude. Please note, this will impact the display globally, not just for the Hortau App.

Contact Us

Thank you

Merci

Gracias