
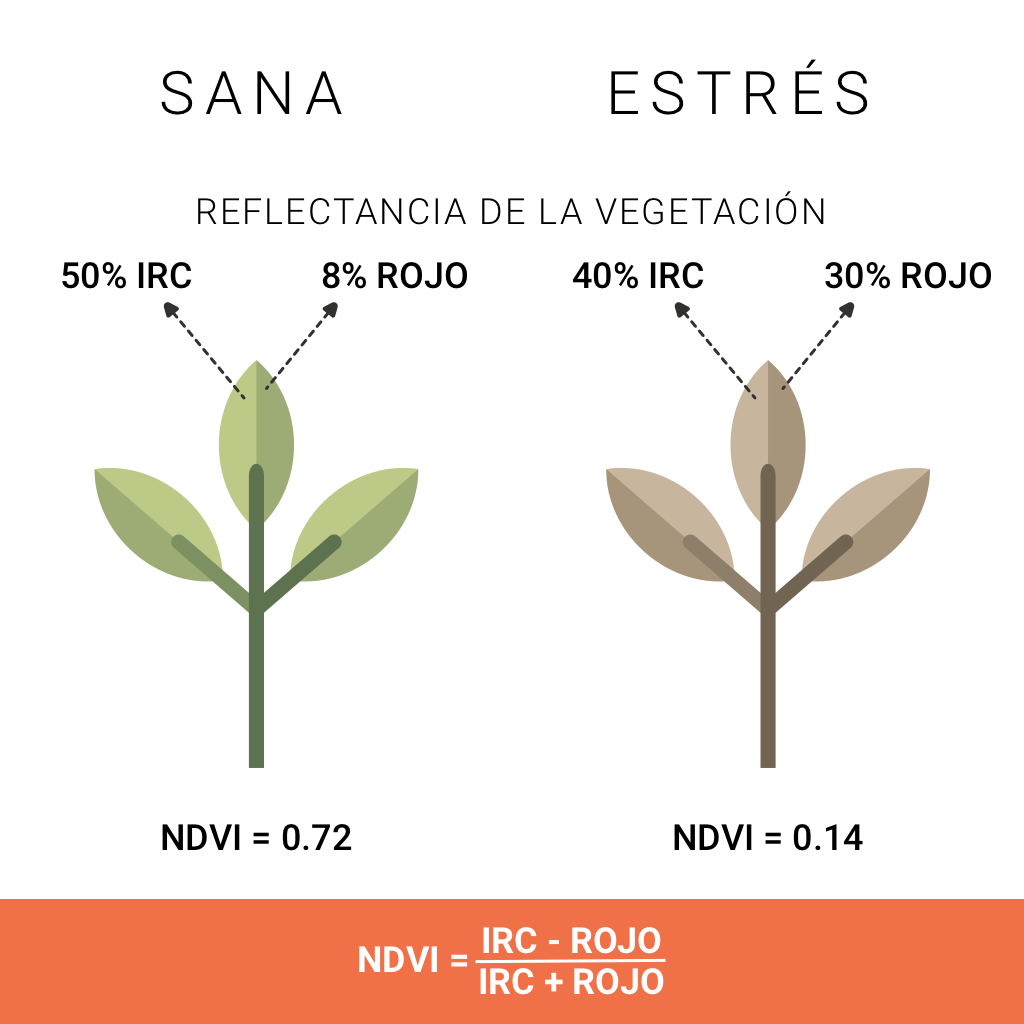
- NDVI significa Índice de Vegetación de Diferencia Normalizada
- Cuantifica la vegetación midiendo la diferencia entre el infrarrojo cercano (que la vegetación refleja fuertemente) y la luz roja (que la vegetación absorbe).
- La clorofila y la fotosíntesis causan absorción de luz en la región roja del espectro.
- Cuanto más saludable es la planta, mayor es el índice.
CÓMO ENTENDER EL MAPA:
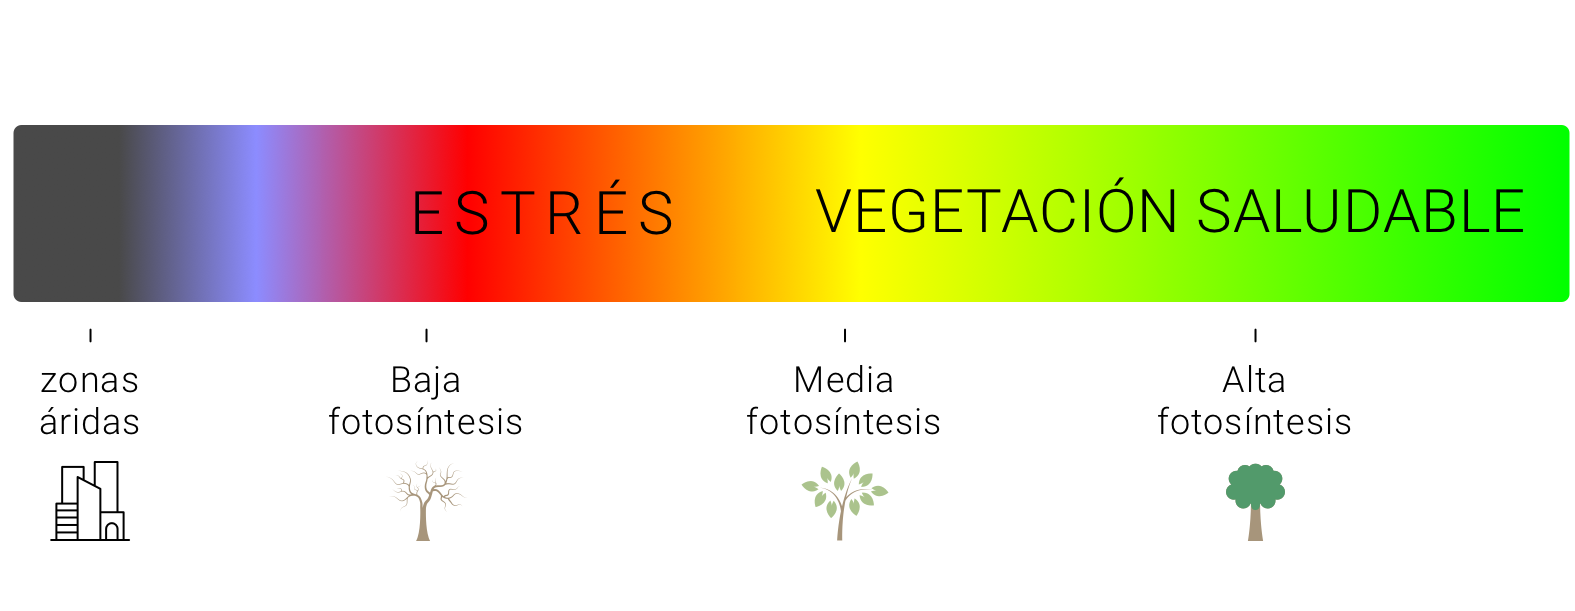
- El índice NDVI es un valor entre -1 y 1.
- Cualquier cosa por debajo de 0.2 no tiene vegetación. Puede ser agua, nieve, un camino, suelo desnudo, nubes, …
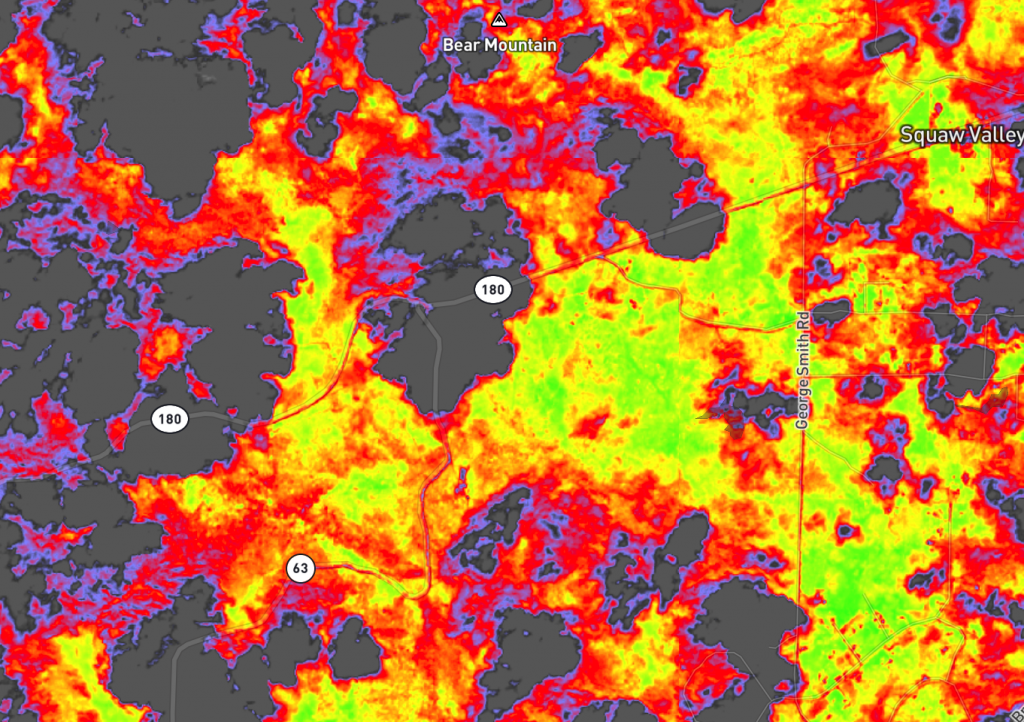
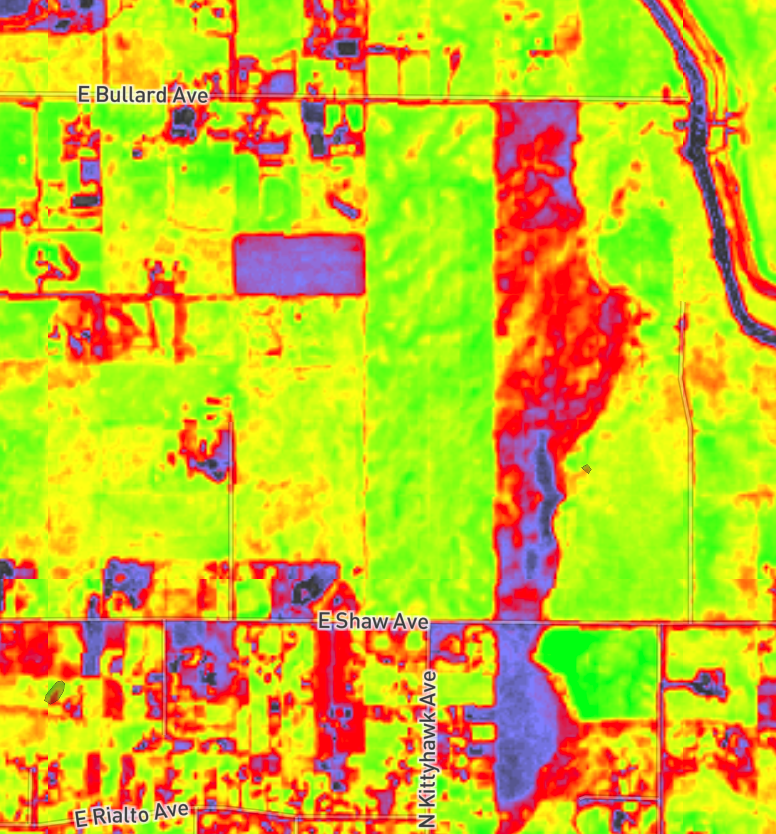
- El gradiente primario de actividad fotosintética es de valores NDVI de 0.2 a 0.9, y eso se representa con un mapa de calor clásico de rojo a amarillo a verde.
- NDVI > 0.9 son de color magenta. El follaje generalmente no tiene valores NDVI tan altos. No deberías ver este color muy a menudo. Corresponde principalmente a artefactos.
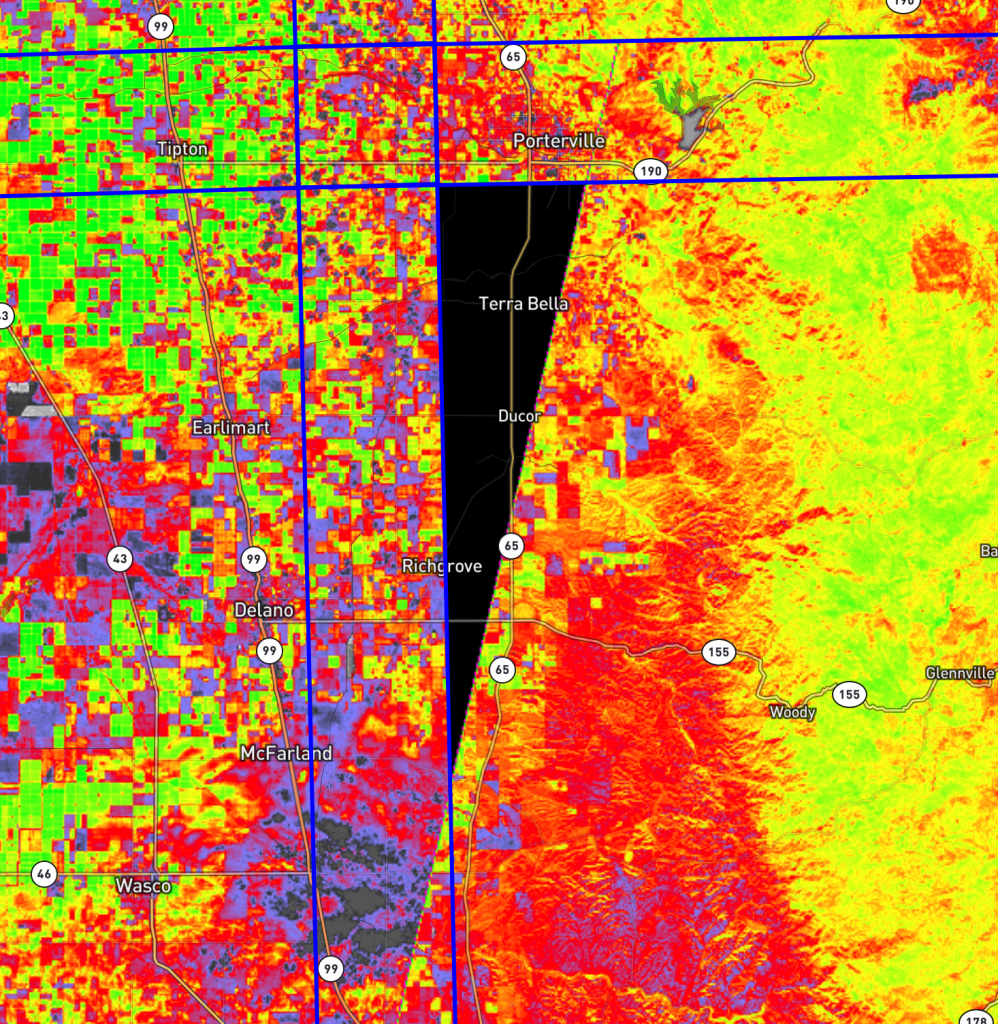
- La leyenda del color es la misma para todos los tipos de cultivos, todos los tipos de suelo y todas las regiones.
QUÉ SIGNIFICA EN AGRICULTURA:
- Los valores de NDVI obtenidos con datos satelitales con alta resolución temporal tienen una fuerte correlación con las etapas fenológicas del cultivo (emergido, madurez, cosecha). Sin embargo, hay ciertas limitaciones. Por ejemplo, durante las primeras etapas del crecimiento del cultivo, cuando el área de la hoja verde es pequeña, los resultados de NDVI son muy sensibles a los efectos de fondo del suelo. El NDVI también puede saturarse en etapas posteriores, cuando los cultivos alcanzan el cierre del dosel y producen resultados inexactos.
- El tipo de cultivo, la edad del cultivo, el ancho de la fila tendrán un impacto en el color que ve en el mapa. Su cultivador podría tener un campo que se muestre principalmente como naranja oscuro para un campo con árboles de hoja sanos del primer año.
- Esto también significa que el NDVI variará a lo largo de la temporada.
- No olvides que la imagen proviene de un satélite, no de un vuelo. La resolución de las imágenes no es tan buena en lo que ofrecen los servicios pagos como Ceres. Nuestro producto brinda información general sobre la salud de un campo. No podrán detectar si una línea tiene fugas ni analizar la salud de un solo árbol. Pero nos da una vista del resto del campo donde no tenemos un sensor de tensión.
- NDVI nos informará sobre la salud de un cultivo. Pero como sabes, agricultura es compleja. Un NDVI bajo no significa que sea causado por riego incorrecto. Podría estar relacionado con muchas otras variables.
La resolución de la imagen es de 10 m por píxel (33 pies).
- Un satélite pasa por Norteamérica cada dos días.
- Todas las noches consultamos el servidor Sentinel y descargamos todas las imágenes con una cobertura de nube inferior al 20% y una cobertura de datos de más del 90%. Por lo tanto, la frecuencia de actualización variará según el clima. Para lugares como California, en verano, deberíamos tener datos actualizados al menos una vez por semana.
El mapa NDVI es un mosaico de múltiples imágenes. Dependiendo del clima, cada imagen puede haber sido tomada en una fecha diferente.
WEB: La fecha que se muestra en la parte inferior de la pantalla es la de la imagen apuntada con el mouse.
MÓVIL: la fecha que se muestra en la parte inferior de la pantalla es la de la imagen en el centro de la vista del mapa.
iPAD: haga clic en el mapa para mostrar la fecha en una información sobre herramientas en la parte inferior del mapa.
- Las imágenes se toman después del hecho. Asegúrese de mirar los datos de tensión anteriores al analizar un mapa NDVI. El impacto de la alta tensión puede tardar un tiempo en notarse en un mapa NDVI.
- NDVI nos informará sobre la salud de un cultivo. Pero como saben, la agricultura es compleja. El agua no es la única variable en juego en la salud de un plan.
- Los valores de NDVI obtenidos con datos satelitales con alta resolución temporal tienen una fuerte correlación con las etapas fenológicas del cultivo (emergido, madurez, cosecha). Sin embargo, hay ciertas limitaciones. El NDVI puede saturarse en etapas posteriores, cuando los cultivos alcanzan el cierre del dosel y producen resultados inexactos.
- El tipo de cultivo, la edad del cultivo, el ancho de la fila tendrán un impacto en el color que ve en el mapa. Su cultivador podría tener un campo que se muestre principalmente como naranja oscuro para un campo con árboles de hoja sanos del primer año.
- Esto también significa que el NDVI variará a lo largo de la temporada.
- Los valores de NDVI obtenidos con datos satelitales con alta resolución temporal tienen una fuerte correlación con las etapas fenológicas del cultivo (emergido, madurez, cosecha). Sin embargo, hay ciertas limitaciones. Por ejemplo, durante las primeras etapas del crecimiento del cultivo, cuando el área de la hoja verde es pequeña, los resultados de NDVI son muy sensibles a los efectos de fondo del suelo. El NDVI también puede saturarse en etapas posteriores, cuando los cultivos alcanzan el cierre del dosel y producen resultados inexactos.
- El tipo de cultivo, la edad del cultivo, el ancho de la fila tendrán un impacto en el color que ve en el mapa. Su cultivador podría tener un campo que se muestre principalmente como naranja oscuro para un campo con árboles de hoja sanos del primer año.
- Esto también significa que el NDVI variará a lo largo de la temporada.
- NDVI nos informará sobre la salud de un cultivo. Pero como saben, la agricultura es compleja. Un NDVI bajo no significa que sea causado por riego incorrecto. Podría estar relacionado con muchas otras variables.
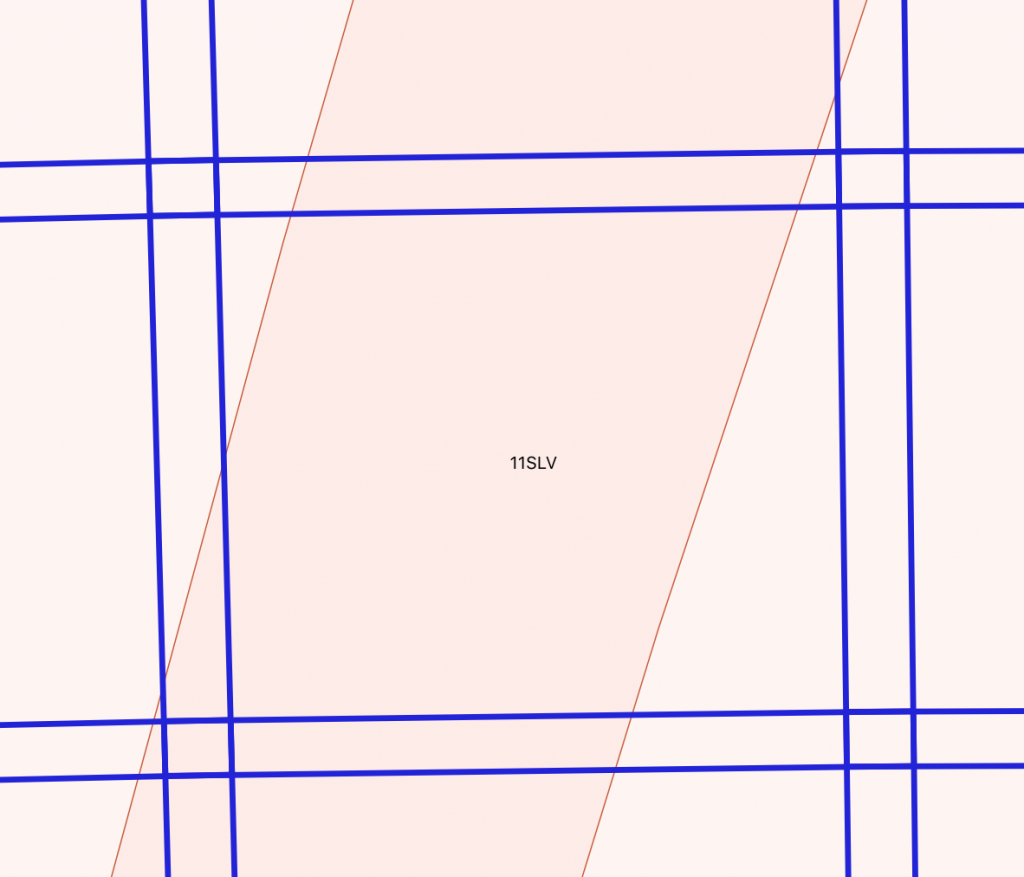
Cada mosaico del Sistema de referencia de cuadrícula militar (MGRS) se puede visitar desde múltiples órbitas relativas, con una cobertura potencialmente diferente del mosaico MGRS.
Nubes.
Las imágenes son tomadas por un satélite para que las partes puedan estar cubiertas por nubes.
Nubes.
Las imágenes son tomadas por un satélite para que las partes puedan estar cubiertas por nubes.
Sí, algunos tipos de productos aplicados en las hojas, como la arcilla de caolín, pueden tener un efecto en el NDVI. En la mayoría de los casos, esto reducirá el nivel de reflectancia. En otras palabras, el color del mapa NDVI se inclinará hacia el lado rojo del espectro.